Indian Textile Export Destination Calculator
Top Textile Export Markets
Compare key metrics for India's top textile export destinations based on FY 2024-25 data.
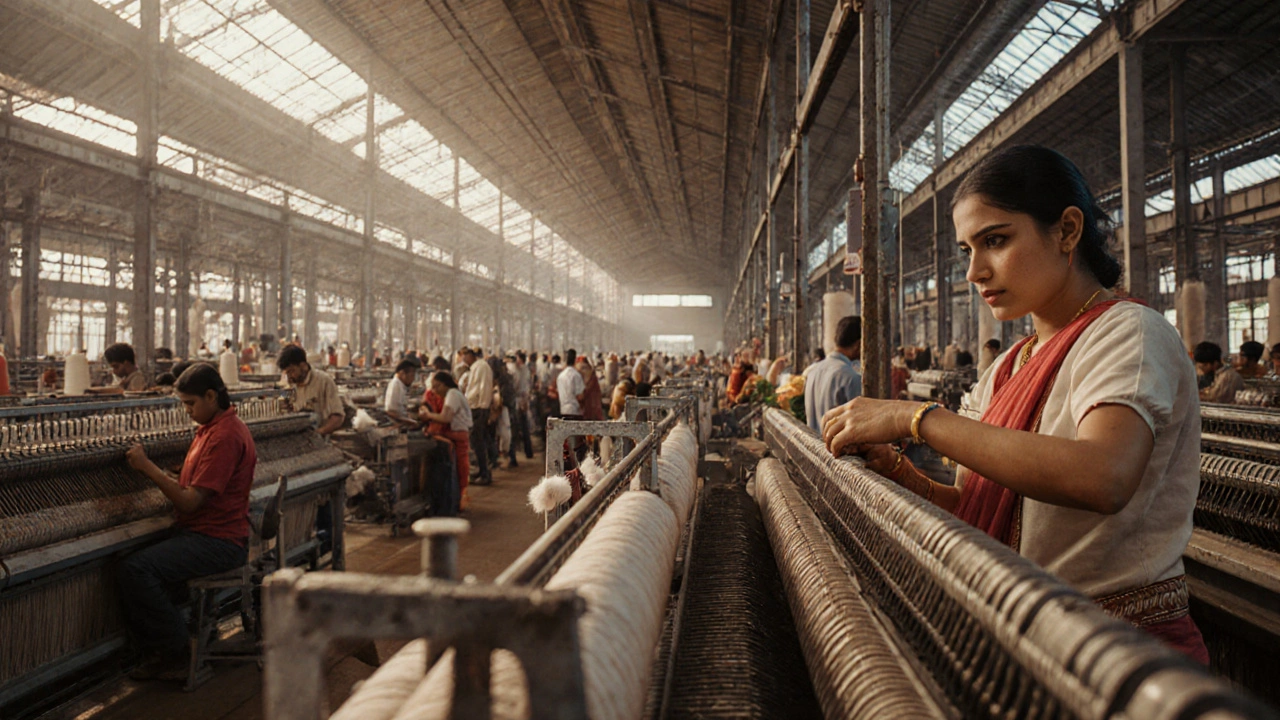
India’s textile industry is a powerhouse, churning out everything from cotton yarn to high‑tech synthetics. Indian textile exports represent the flow of fabrics, garments, and home‑textile products from India to overseas buyers, accounting for a significant share of the nation’s trade earnings. If you’re curious about where this massive flow ends up, the numbers for 2025 tell a clear story about demand hubs, shifting preferences, and emerging opportunities.
Why the Indian textile sector matters globally
In fiscal year 2024‑25, India shipped roughly US$43billion worth of textiles, making it the world’s second‑largest exporter after China. The sector employs over 45million workers, many of whom are women, and contributes around 2% to the country’s GDP. The Ministry of Textiles oversees policy, incentives, and quality standards that keep Indian fabrics competitive on the world stage. Understanding the top buyers helps manufacturers tailor designs, negotiate better terms, and tap into government schemes like the GIFT (General Incentives for Textile Exporters) which provides duty exemptions and cash incentives for approved exporters.
Top five countries receiving Indian textiles
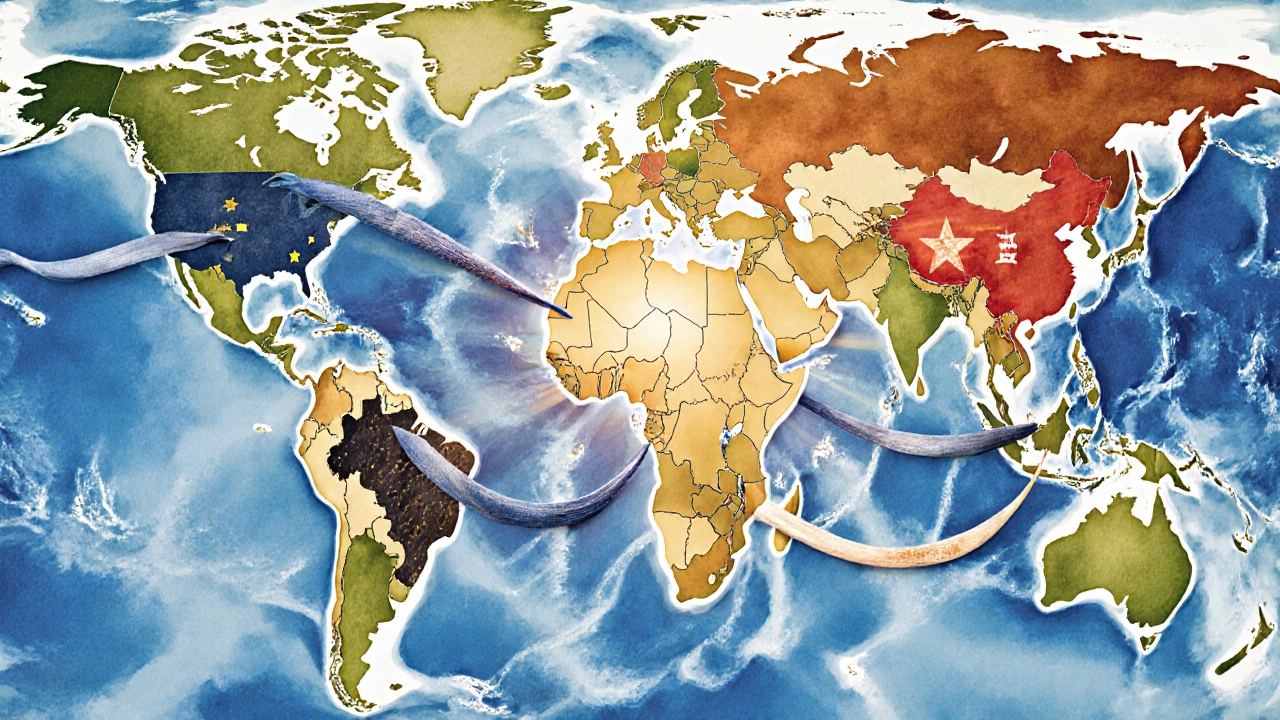
Export data from the Directorate General of Commercial Intelligence (DGCI) and customs records consistently highlight five destinations that together account for nearly 65% of total value. Below is a snapshot for the year ending March2025:
| Rank | Country / Region | Export Value (US$bn) | Share of Total | Key Products |
|---|---|---|---|---|
| 1 | United States | 9.8 | 22.8% | Cotton garments, denim, knitwear |
| 2 | European Union (combined) | 8.5 | 19.8% | Technical textiles, home‑textiles, wool blends |
| 3 | United Arab Emirates | 5.1 | 11.9% | Luxury fabrics, silk blends, ready‑made garments |
| 4 | Bangladesh | 4.3 | 10.0% | Raw cotton, yarn, fabric for downstream processing |
| 5 | China | 3.6 | 8.4% | Synthetic fibers, polyester blends, industrial textiles |
What each market prefers
United States remains the biggest single‑buyer, driven by a strong appetite for sustainable cotton and premium denim. American retailers such as Gap, Levi’s, and Patagonia source large volumes of organic cotton yarn and pre‑finished garments, paying a premium for traceability. The European Union focuses on technical and home‑textile categories, where Indian manufacturers excel in low‑cost but high‑quality production. EU standards on fire safety and eco‑labelling push exporters toward certified fabrics, but the market rewards consistency.
In the Middle East especially the UAE, demand skews toward luxury silk blends and designer ready‑made collections for high‑end boutiques. Fast fashion chains operating out of Dubai’s logistics hubs also import bulk cotton and polyester blends for re‑branding under private labels. Bangladesh acts primarily as a semi‑finished goods supplier, buying raw cotton and yarn to feed its massive garment factories. The trade flow is often reversible: Indian yarn arrives, gets woven in Bangladesh, then returns as finished apparel to European or American markets.
China, despite being a competitor, purchases specific synthetic fibers and industrial textiles where Indian cost advantage outweighs domestic capacity gaps. This niche exchange supports Indian petrochemical‑based yarn producers who specialize in high‑tenacity polyester and nylon.
Trends shaping export destinations (2022‑2025)
Three major forces have reshaped the export map over the past three years:
- Shift to sustainable fabrics: Global buyers are demanding GOTS‑certified organic cotton. India’s organic acreage grew from 2% of total cotton area in 2021 to 5% in 2024, pushing up shipments to eco‑conscious markets like the US and Scandinavia.
- Geo‑political realignments: US‑China trade tensions spurred American retailers to diversify sourcing, boosting Indian share from 12% in 2020 to 22% in 2025. The EU’s “Strategic Autonomy” plan also encouraged imports from non‑EU partners meeting strict carbon‑footprint criteria, benefitting Indian manufacturers with renewable‑energy‑powered mills.
- Digital trade platforms: The rise of B2B marketplaces such as TradeIndia and Alibaba’s “Made‑in‑India” portal reduced transaction costs, making it easier for smaller exporters to reach UAE and African buyers.
Key policy levers helping exporters
Several government measures directly impact the flow to the top destinations:
- GIFT scheme offers up to 10% duty exemption on raw material imports for approved exporters. This lowers input costs for high‑volume cotton yarn destined for the US market.
- The Reduced GST for textiles (from 12% to 5% on certain finished garments) makes Indian pricing more competitive against Chinese offerings.
- Export Promotion Councils (EPCs) run buyer‑seller meets in Dubai and Berlin, creating direct pipelines to the UAE and EU buyers highlighted in the table above.

Opportunities and challenges for the next five years
Opportunities:
- Smart textiles: US defense contracts and EU health‑care projects are scouting Indian firms for conductive fabrics. Early‑stage partnerships could open a $3bn niche by 2030.
- North‑African markets: Proximity to the Mediterranean and favorable trade agreements make Algeria and Morocco attractive new destinations for cotton blends.
- Value‑added processing: Investing in automated stitching and finishing lines can lift export value per kilogram, especially for premium denim heading to the US.
Challenges:
- Rising input costs: Global cotton prices spiked to $2.90 per pound in 2024, squeezing margins for low‑end exporters.
- Regulatory compliance: EU’s REACH chemicals regulation forces Indian dye manufacturers to upgrade wastewater treatment, an expense many SMEs can’t shoulder.
- Logistics bottlenecks: Port congestion at Mundra and Chennai adds 2‑3 days to lead times, eroding the speed advantage over Chinese competitors.
Key takeaways
- The United States, European Union, UAE, Bangladesh and China together capture almost two‑thirds of India’s textile export value.
- Sustainability and digital marketplaces are the primary drivers of recent market shifts.
- Government incentives like GIFT and reduced GST are crucial levers for maintaining price competitiveness.
- Emerging segments such as smart fabrics and North‑African demand present high‑growth pathways.
- Addressing input‑cost volatility, compliance costs, and logistics delays will be essential for future expansion.
Frequently Asked Questions
Which country is the largest importer of Indian textiles?
The United States leads with about $9.8billion in imports, representing roughly 23% of India’s total textile export value in FY2024‑25.
How much did India earn from textile exports in 2025?
Export earnings reached approximately US$43billion for the fiscal year ending March2025.
What are the top textile products shipped to the EU?
The EU mainly imports technical textiles (industrial filters, geotextiles), home‑textiles (bed linen, curtains), and wool‑blend fabrics, accounting for about $8.5billion in value.
How does the GIFT scheme help exporters?
GIFT provides duty exemptions on raw material imports and cash incentives on export performance, lowering production costs and improving profit margins for eligible firms.
Are there new markets Indian textiles are targeting?
North‑African countries such as Algeria and Morocco, as well as smart‑fabric segments for defense and health‑care, are gaining attention as high‑growth opportunities.
